Night View |
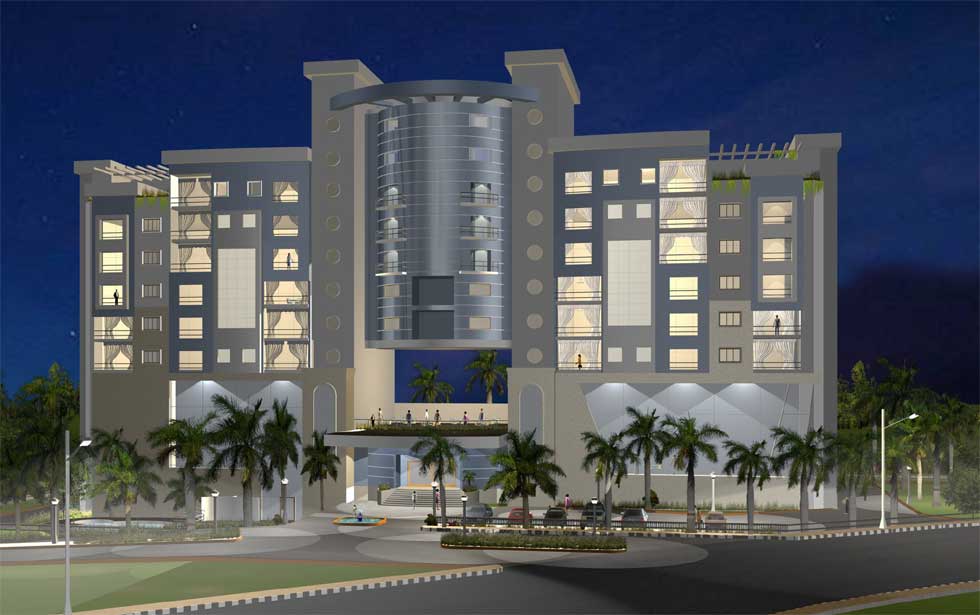 |
PROPOSED HOTEL AT :ELECTRONIC CITY ~BANGALORE |
Projected Profitability |
Description |
2010-11 |
2011-12 |
2012-13 |
2013-14 |
2014-15 |
2015-16 |
2016-17 |
2017-18 |
2018-19 |
2019-20 |
2020-21 |
| Total number of rooms | 120.00 |
120.00 |
120.00 |
120.00 |
120.00 |
120.00 |
120.00 |
120.00 |
120.00 |
120.00 |
120.00 |
| Days available for occupation in the year | 90 |
365 |
365 |
365 |
365 |
365 |
365 |
365 |
365 |
365 |
365 |
| Estimated average annual occupancy rate | 45% |
50% |
60% |
65% |
70% |
75% |
75% |
75% |
75% |
75% |
75% |
Room nights sold per annum [Nos.] |
4,860.00 |
21,900 |
26,280 |
28,470 |
30,660 |
32,850 |
32,850 |
32,850 |
32,850 |
32,850 |
32,850 |
| Average daily rate [including taxes - in Rs.] | 4,000 |
4,200 |
4,494 |
4,719 |
5,002 |
5,302 |
5,620 |
5,957 |
6,314 |
6,693 |
7,095 |
Average daily rate growth (%) |
0.00% |
5.00% |
7.00% |
5.00% |
6.00% |
6.00% |
6.00% |
6.00% |
6.00% |
6.00% |
6.00% |
| Estimated F & B sales per room [in Rs.] | 750 |
788 |
827 |
868 |
920 |
975 |
1,034 |
1,096 |
1,162 |
1,232 |
1,306 |
| Average rate growth (%) | 00% |
5.00% |
5.00% |
5.00% |
6.00% |
6.00% |
6.00% |
6.00% |
6.00% |
6.00% |
6.00% |
Estimated service sales per room [in Rs.] |
250 |
263 |
276 |
290 |
307 |
325 |
345 |
366 |
388 |
411 |
436 |
| Average rate growth (%) | 0.00% |
5.00% |
5.00% |
5.00% |
6.00% |
6.00% |
6.00% |
6.00% |
6.00% |
6.00% |
6.00% |
| Income from room rents | 194.40 |
919.80 |
1.181.02 |
1,343.50 |
1,533.61 |
1,741.71 |
1,846.17 |
1,956.87 |
2,074.15 |
2198.65 |
2,330,71 |
| Income from F&B sales | 36.45 |
172.57 |
217.34 |
247.12 |
282.07 |
320.29 |
339.67 |
360.04 |
381.27 |
404.71 |
429.02 |
Income from other services |
12.15 |
62.60 |
72.53 |
82.56 |
94.13 |
106.76 |
113.33 |
120.23 |
127.46 |
135.01 |
143.23 |
| Increase / (Decrease) in inventory | 12.15 |
14.18 |
17.86 |
20.31 |
23.18 |
26.33 |
27.92 |
29.59 |
31.37 |
33.26 |
35.26 |
Total Income |
255.05 |
14.18 |
17.86 |
20.31 |
23.18 |
26.33 |
27.92 |
29.59 |
31.37 |
33.26 |
35.26 |
| Operating cost | |||||||||||
| F&B Cost | 14.58 |
69.03 |
86.93 |
98.85 |
112.83 |
128.12 |
135.87 |
144.01 |
152.69 |
161.88 |
171.61 |
Operating costs |
76.5 |
344.99 |
441.27 |
501.95 |
572.94 |
650.63 |
689.75 |
731.14 |
775.00 |
821.51 |
870.89 |
| Lease Rentals | - |
- |
- |
- |
- |
- |
- |
- |
- |
- |
- |